Functional Movement Screening Doesn't Predict Injury. Here's What Does.
Clinical Research
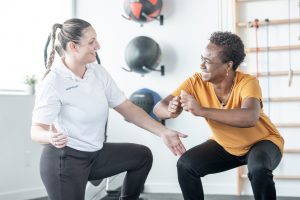
Movement screens earned their place in rehab. The Functional Movement Screen gave clinicians a shared language for movement quality: a standardized, repeatable way to watch someone move, flag asymmetries, and clear for pain.
If you have spent any time in this field, you have run hundreds of them. There is real value in that common starting point.
But here is the uncomfortable part the evidence has made hard to ignore: the FMS doesn’t predict who gets injured. And the corrective exercise built to “fix” what it finds doesn’t reliably prevent injury either.
That is not an indictment of the clinicians using it. It is a mismatch between what the tool was designed to do and the job the field keeps asking it to do.
So this is not another walkthrough of the seven tests and the composite score. You already know those. It is about three things worth sitting with:
- Why the screen fails as a predictor
- Why the standard corrective “fix” doesn’t move injury rates
- What the evidence says actually reduces risk — and where objective measurement fits
What the FMS Is Good For, and What It Isn’t
The FMS was developed in the mid-1990s to observe fundamental movement quality in asymptomatic individuals. As a shared, repeatable language for how someone moves, it is genuinely useful. It was simply never built to be a crystal ball for injury.
| What it’s genuinely good at | What it was never built to do |
|---|---|
| Standardizing observation across clinicians | Predict who will get injured |
| Flagging gross asymmetries | Quantify how much force a limb produces |
| Giving a team a shared baseline | Justify a corrective plan on its own |
| Clearing for pain as a referral gateway | Measure change in capacity over time |

The Screen Doesn’t Predict Injury
The most direct evidence comes from meta-analysis, not a single study. Dorrel and colleagues pooled the prospective literature in active adults, and the numbers are not close:
| 24.7% | 85.7% | AUC 0.587 |
|---|---|---|
| Sensitivity
How often it catches who will get hurt |
Specificity
How often it clears who won’t |
Predictive accuracy
0.5 would be a coin flip |
Their conclusion was blunt: the findings do not support the predictive validity of the FMS.1
Sit with that specificity-over-sensitivity split. A tool that is strong on specificity but weak on sensitivity is decent at telling you who will not get hurt, but poor at catching who will. For a screen whose entire purpose is to flag elevated risk, that is backwards.
And this is not one contrarian paper. A separate systematic review and meta-analysis reached the same conclusion: composite FMS scores do not predict subsequent injury.2
The famous cutoff of 14 or below has been challenged just as hard. A study of roughly 581 firefighters found no association between FMS score and injury claims, and no cutoff that meaningfully separated the injured from the uninjured.3 Screen performance swings widely from one population to the next.
So the honest read is not that the screen is worthless. It is a description of current movement quality, not a prediction of future injury — and the trouble starts only when we confuse the two.
Corrective Exercise, the Logical “Fix,” Doesn’t Prevent Injury Either
If a screen flags a faulty pattern, the intuitive next step is to correct that pattern. It is a clean story. It also does not hold up well in the evidence:
- Corrective-exercise reviews find poor evidence that fixing specific patterns prevents injury — because injury is multifactorial (biological, psychological, and social), not a single correctable flaw.
- Static stretching, a cornerstone of many corrective approaches, has moderate-to-strong evidence against it as an injury-reduction strategy.
- Endurance runners: a 2024 systematic review and meta-analysis found that exercise-based prevention programs produced no reduction in injury risk or rate compared with running alone.4
One distinction is the whole hinge of the argument: this is about corrective exercise aimed at fixing screen-identified patterns, not about strength training. Those are not the same intervention — which brings us to what does work.
So What Actually Reduces Injury Risk?
If screens do not predict and pattern-correctives do not prevent, that is not a dead end. The evidence points clearly to a handful of levers that do move injury rates. Most are unglamorous. All are more actionable than a composite score.
| Factor | What the evidence shows |
|---|---|
| Load management | Spikes in training load relative to what the body is adapted to (the acute-to-chronic workload ratio) are consistently linked to injury. Ramp rate is the most controllable risk factor there is. |
| Strength training | The most robust evidence of any intervention. Programs including the Nordic hamstring exercise roughly halve hamstring injuries.5 This is progressive loading to build capacity, not pattern-fixing. |
| Neuromuscular warm-ups | Programs like FIFA 11+ show strong team-sport evidence — and they work through their strength and motor-control content, not by correcting screen-flagged patterns. |
| Sleep | Adolescent athletes sleeping under 8 hours a night carried roughly 1.7× the injury risk of peers who got 8 or more.6 Sleep loss degrades reaction time, tissue repair, and recovery. |
| Psychological factors | Stress, major life events, and poor coping are associated with injury; mindfulness-based interventions show measurable risk reduction. Injury is not a purely mechanical event. |
Notice the common thread: capacity, load, and recovery, not movement aesthetics. That quietly rewrites the clinician’s job from “spot and fix faulty patterns” to “build and document capacity.”
Where Objective Measurement Actually Fits
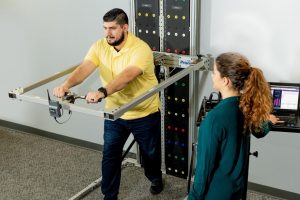
A composite score tells you a movement looked off. It does not tell you how much force the limb can produce, how symmetrical it is, or whether capacity is improving. That is measurement, not observation — and it is the layer the evidence says matters.
| System | What it does | Where it fits |
|---|---|---|
| PrimusRS | Objective multi-joint strength measurement on a platform that also delivers rehabilitation. | Baseline and then load the capacity that actually protects. |
| Evaluator / EVJ | Portable objective strength and range-of-motion measurement. | Satellite locations and on-site settings. |
| EvalTech / Prism | Complete Functional Capacity Evaluations with automated reporting. | Occupational health, hiring, and return-to-work decisions. |
The honest through-line: preventing injuries is impossible, but reducing injury risk is achievable. What objective measurement does is let you build, dose, and document the strength and load capacity the research actually supports, then prove that progress to patients, referrers, and payers.
What This Means for Your Clinic
You do not have to throw out the screen. You just have to use it for the right job.
Keep using the FMS for:
- A fast, standardized snapshot of movement quality
- A pain-clearing gateway that tells you when to refer
- Measuring global movements to determine what needs further assessment
Stop asking it to:
- Predict who will get injured
- Justify a corrective-exercise plan on its own
Then shift the emphasis, and the documentation, toward capacity: objective strength, side-to-side symmetry, and how they change over time. That is what holds up under payer scrutiny, and it is what actually tracks with reduced risk.
It is also a differentiator. “Here is the measured strength deficit, here is the load we built, here is the objective change at re-test” is a very different story than “the deep squat improved from a 1 to a 2.”
The Bottom Line
The screen was never the problem. Asking it to do a job it was never designed for was. The clinics pulling ahead aren’t the ones running more screens — they’re the ones measuring what actually matters, and proving it.
If you are ready to build that layer into your practice, explore BTE’s evaluation product line or request a demo.