Limb Symmetry Index: Calculation, Limits, and Better Return-to-Sport Data
Treatment Guidelines
Learn how to calculate the limb symmetry index (LSI), where it falls short, and which other measures can inform return-to-sport decisions.
The limb symmetry index is one of the most widely used tools in return-to-sport testing and discharge planning. But widespread use does not mean the tool is without problems. The 90% threshold that most clinicians work from was built on data from healthy people, not from any evidence that reaching it actually protects a recovering patient from reinjury.
The deeper issue is structural. LSI is not a direct measurement. It is a ratio of two separate measurements, and it is only meaningful if the reference value stays stable. When the uninvolved limb is used as the reference point and that limb is itself changing over time, the ratio can tell a misleading story. This article explains why that happens, what the research shows, and what a more reliable testing approach looks like in practice.
What Is the Limb Symmetry Index?
How to Calculate the Limb Symmetry Index: Formula and Worked Example
The limb symmetry index compares how the injured limb is performing relative to the uninjured limb. The standard formula divides the involved limb value by the uninvolved limb value and multiplies by 100 to produce a percentage:
LSI = (Involved limb ÷ Uninvolved limb) × 100
For a patient with quadriceps peak torque of 182 Nm on the involved side and 204 Nm on the uninvolved side:
(182 ÷ 204) × 100 = 89.2%
The result is a single percentage. It tells you how close the injured side is to the uninjured side. What it does not tell you is whether either limb is actually strong enough, and that is where the problems begin.
Limb Symmetry Index Formula Variants: Distance, Timed, and Strength Tests
The limb symmetry index is calculated differently depending on the type of test being used. There are three main variants: distance-based tests, timed tests, and strength tests.
| Test Type | Formula | Worked Example |
| Distance-based hop (single, triple, crossover) | (Involved distance ÷ Uninvolved distance) × 100 | 138 cm ÷ 155 cm × 100 = 89.0% |
| Timed hop (6-metre timed hop) | (Uninvolved time ÷ Involved time) × 100 | 1.82 s ÷ 2.04 s × 100 = 89.2% |
| Strength (isokinetic/isometric peak torque) | (Involved peak torque ÷ Uninvolved peak torque) × 100 | 182 Nm ÷ 204 Nm × 100 = 89.2% |
In ACL rehabilitation, the most commonly used functional LSI tests are the four-test single-leg hop battery: the single hop, triple hop, crossover hop, and 6-metre timed hop. Single-limb sit-to-stand tests are also used throughout the rehabilitation continuum, offering insight into strength and motor control that hop tests do not capture. Isokinetic dynamometry or isometric peak force testing offers a more controlled environment with less room for compensation, though it does require specialized equipment.
What Is a Good Limb Symmetry Index Score? Where the 90% Threshold Came From
The 90% LSI threshold is the most commonly cited benchmark for return-to-sport clearance. But it is worth understanding where it came from. It was not derived from evidence that reaching 90% prevents reinjury. It was taken from normative data collected in healthy, uninjured people, where between-limb differences are naturally small and scores tend to cluster near 100%.
In other words, 90+% describes typical findings in someone who has never been injured. It does not tell us what level of symmetry actually protects a post-operative patient. Some researchers now argue the threshold should be 95% or above, since healthy athletes routinely score higher than 90% anyway. Others have proposed a modified limb symmetry index formula that compares the injured limb to the uninjured limb’s pre-surgery value rather than its current value. Either way, any fixed threshold applied to a ratio with a shifting denominator is answering a different question than the one we think we are asking. The research makes clear why.
Why the Limb Symmetry Index Overestimates Return-to-Sport Readiness
What Wellsandt et al. Found About LSI and Second ACL Injury
A 2017 study by Wellsandt, Failla, and Snyder-Mackler tested 70 athletes on quadriceps strength and a four-test hop battery before ACL reconstruction and again at six months post-operatively. Forty of those athletes (57.1%) reached the 90% LSI threshold across all measures. But only 20 (28.6%) reached 90% when compared against their own pre-injury baseline, a metric the researchers called estimated preinjury capacity, or EPIC. Twenty-four patients (34.3%) passed every LSI test without meeting the EPIC standard, meaning LSI alone would have cleared them for return to sport prematurely.
When it came to predicting who would sustain a second ACL injury, EPIC was substantially more accurate than LSI (AUC 0.818 vs. 0.273). An AUC of 0.273 is below chance, meaning LSI was effectively no better than a coin flip for identifying patients at risk. The study was a prospective cohort at a single centre (Level of Evidence 2b), which limits how broadly the findings can be generalised, but the underlying mechanism is not sample-specific.
Why the Uninvolved Limb Is Not a Fixed Baseline After ACL Reconstruction
The intuitive explanation for why LSI overestimates recovery is that the injured limb is not performing as well as the score suggests. The mechanism Wellsandt identified is different, and it is worth understanding precisely.
The uninjured limb does not stay the same after ACL reconstruction. It deconditions. Training load drops during the recovery period, and without regular loading, the uninvolved side loses strength too. As that happens, the number on the bottom of the LSI formula gets smaller. A smaller denominator produces a higher ratio, even when the injured limb has not actually improved. A patient can show a rising LSI at six months compared to two months, not because they got stronger on the injured side, but because the reference limb got weaker.
A rising LSI score can describe a patient who is getting worse on both sides. Symmetry is not the same as recovery.
This is not a calculation error. The formula is being used correctly. The problem is that the reference point is not stable. The fix is not a better formula. It is better data: measuring both limbs repeatedly, starting from the earliest possible baseline, so that changes in the uninjured limb are visible rather than hidden inside a ratio. That is what a well-designed bilateral strength testing protocol needs to deliver.
Estimated Preinjury Capacity (EPIC): A Better Reference Standard for Limb Symmetry Index
Estimated preinjury capacity addresses this by changing the reference point. Instead of comparing the injured limb to the uninjured limb at the same point in time, EPIC compares the injured limb at follow-up to the uninjured limb as it was measured before surgery. That gives you a fixed reference that does not move. Any change you see in the ratio reflects real change in the injured limb, not drift in the baseline.
In practice, this requires capturing a bilateral baseline as early as possible, ideally before surgery, and then using that same protocol at every subsequent testing session. Most clinics do not have pre-injury data, because testing typically begins after the injury is confirmed. When a pre-operative baseline is not available, a realistic fallback hierarchy is:
- Pre-operative testing: the strongest option. Both limbs are tested before surgery, capturing the uninjured side before deconditioning begins.
- Earliest available bilateral baseline after surgery: weaker than pre-operative data, but still more useful than a single endpoint measurement. It at least establishes a starting trajectory.
- Absolute normative comparison: the weakest standalone option, but more useful than it might seem when population-specific data is available. General normative values reflect broad averages and cannot account for an individual’s pre-injury capacity. However, when age, sex, and sport-matched norms exist — such as published normative data for high school male and female athletes across basketball, football, lacrosse, and soccer — comparing performance metrics against healthy controls provides meaningful clinical context that LSI alone cannot. This kind of normative comparison is not a replacement for bilateral baseline data, but it is a valuable complement, particularly when LSI’s limitations are already in view.
The Limits of a Single Limb Symmetry Index Score
Two limbs can be perfectly symmetrical and still both be weak. An athlete performing at 85% of their pre-injury capacity on both sides will have an LSI of 100%. The ratio looks fine. The patient is not ready. Absolute strength values need to be reported alongside the ratio, not treated as optional. For more on ACL reconstruction and return-to-sport criteria, see the BTE ACL guide.
The reference standard is one problem. The ratio itself is another.

Hop Test vs. Isometric vs. Isokinetic LSI: Why the Task Changes the Score
Not all LSI scores are created equal, and which test you use matters more than many protocols acknowledge. Hop-derived LSI, isometric peak-force LSI, and isokinetic peak-torque LSI are measuring different things. An athlete can pass on one and fail on another. Hop tests capture a broad mix of strength, power, coordination, and confidence, which makes them practical but also means a patient can compensate their way through them. Isometric and isokinetic strength tests are more controlled and isolate the muscular contribution more directly, though the score is specific to the speed and joint angle used.
Comparing results across studies or timepoints only works if the testing conditions are held constant. An LSI score reported without specifying the test, speed, or joint position cannot be reliably replicated, which makes cross-study comparison unreliable and within-clinic tracking difficult. For a more detailed look at lower extremity strength assessment protocols, see the BTE protocol guide. Note, hamstring-to-quadriceps ratios address a separate clinical question and are not covered here.
Measurement Error and Minimal Detectable Change: Is a Shift in LSI Score Actually Real?
Every LSI score is built from two measurements, and both of those measurements carry some degree of error. If that error is large enough to shift the ratio across a threshold between sessions, the threshold stops being a reliable signal.
There are two types of reliability that matter here:
- Relative reliability (measured by an intraclass correlation coefficient, or ICC) tells you whether an instrument ranks patients consistently across sessions. A high ICC means the device produces consistent ordering.
- Absolute reliability (measured by standard error of measurement or limits of agreement) tells you how much a single patient’s score can shift between sessions due to measurement variability alone, with no real change in the patient. This second number is the one that matters most for interpreting LSI over time.
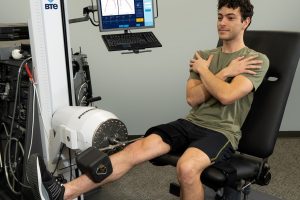
The BTE PrimusRS is one of the few rehabilitation devices with published intersession reliability data for this type of testing. In a study by Hamacher et al. (PMID 28338383), ICC values for knee and elbow extension and flexion ranged from .954 to .991, indicating strong relative reliability. Absolute reliability was more variable, with limits of agreement exceeding 16 Nm in some exercises, which the authors noted should be weighed against the demands of each specific application.
That published data matters more than it might seem. When you know a device’s measurement error, you can calculate the minimal detectable change for your protocol and determine whether a shift in LSI reflects real patient progress or falls within the noise. This is a core principle of sound rehab outcome measurement. Without published reliability data, that calculation is not possible, and the absence of data is not evidence of reliability.
Knowing where LSI can mislead is the foundation. Building a protocol that guards against those limitations is what follows.
How to Build a Bilateral Strength Testing Protocol for Limb Symmetry Index
When and How to Capture a Bilateral Baseline for LSI
Start testing as early as the clinical situation allows and hold every protocol element constant from that point forward. Any variation in how the test is set up between sessions can look like patient change in the data. The following elements need to stay the same across every testing session:
- Device and model: do not switch instruments between timepoints.
- Angular velocity (isokinetic) or joint angle (isometric): specify and document at first session; replicate exactly.
- Joint positioning and stabilisation: use the same seat position, pad placement, and stabilisation straps.
- Warm-up and rest intervals: standardize duration and load; fatigue state at testing affects peak torque.
- Rater: maintain the same tester where possible; if raters change, document and account for inter-rater variability.
- Number of repetitions and which value is used: peak torque from the highest single repetition and average of three repetitions are not interchangeable across sessions.
What to Report Alongside a Limb Symmetry Index Score
An LSI percentage on its own is not enough information to be meaningful. Whether the result is going into a research manuscript, a clinical record, or discharge documentation, the same minimum set of information needs to accompany it. For discharge and clearance purposes specifically, the testing modality and timepoint matter most: a payer, physician, or legal reviewer needs to know what was measured, when, and on what device.
| Minimum Reporting Set for an LSI Value | |
| Involved limb value | Absolute peak torque (Nm) or hop distance (cm) or time (s) |
| Uninvolved limb value | Same metric, same session |
| LSI ratio | Percentage, to one decimal place |
| Testing modality | Hop test (specify which), isometric, or isokinetic |
| Protocol parameters | Angular velocity (isokinetic), joint angle (isometric), limb position |
| Timepoint | Weeks/months post-op, or weeks from return-to-sport clearance |
| Instrument | Device name and model; published reliability coefficient if available |
| Known measurement error | MDC or limits of agreement if published for this instrument/protocol |
What Bilateral Dynamometry Needs to Deliver for LSI to Be Defensible
Why Published Intersession Reliability Data Is Non-Negotiable for Isokinetic LSI
Manual muscle testing cannot produce an LSI that holds up in research or legal contexts. The variability between raters is too wide and the scale is too coarse to detect the kind of between-session changes that matter in post-operative monitoring. More importantly, it does a disservice to the patient: without precise, repeatable measurement, clinicians lack the information needed to make sound clinical decisions at the moments that matter most.
The case for instrumented isokinetic dynamometry is not that it is perfect, but that its error is known, documented, and accounted for. BTE’s published intersession reliability data is available through the PrimusRS clinical research archive.
What PrimusRS Progress and Session Reports Show
Addressing the moving-denominator problem requires software that tracks both limbs across the full plan of care, not just at a single testing session. The PrimusRS’ new software platform, Joule, brings three reporting capabilities that directly address this:
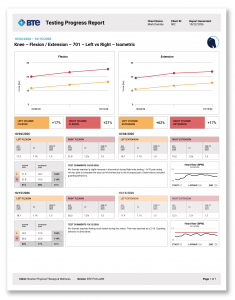
- PrimusRS’ Joule progress reports show absolute strength values for both limbs at every session across the plan of care. This makes changes in the uninjured limb visible with graphs rather than hidden inside a ratio. If the LSI is rising, you can see whether that reflects the injured limb getting stronger, the uninjured limb getting weaker, or both.
- PrimusRS’ Joule session reports show force through the full range of motion and strength output per repetition, rather than a single averaged figure for the set. The range-of-motion view shows exactly where in the movement a patient’s output changes and by how much, which helps identify where targeted or isolated work is still needed. The per-repetition view surfaces how strength holds up across a set, giving meaningful insight into endurance and fatigue patterns. In practice, a patient might show adequate peak torque in early reps but a progressive drop-off by rep four or five, or adequate mid-range strength but a deficit in terminal extension. Either pattern would be invisible in a single LSI percentage but directly informs programming decisions.
- Concentric and eccentric values are reported separately rather than averaged together. This matters because the two can recover at different rates, and a single averaged LSI score discards that distinction entirely. A patient can pass a concentric threshold and still carry a meaningful eccentric deficit that the averaged score conceals.
LSI will remain part of return-to-sport decision-making for the foreseeable future. What needs to change is not the tool but the expectations placed on it, and the measurement infrastructure that supports it. A percentage tells you something. It does not tell you everything.
Limb Symmetry Index: Frequently Asked Questions
How do you calculate the limb symmetry index?
Divide the involved limb value by the uninvolved limb value and multiply by 100. For timed tests, reverse the numerator and denominator because a lower time indicates better performance. The formula table in this article shows worked examples for all three test types.
Is the 90% LSI threshold still defensible?
As a clinical convention, yes. As a biological clearance point, no. The figure derives from normative data in healthy cohorts. Wellsandt et al. (2017) found LSI near chance-level sensitivity for predicting second ACL injury (AUC 0.273). Several authors now recommend 95% or higher.
Why does LSI overestimate return-to-sport readiness?
The uninvolved limb deconditions after ACLR, reducing the denominator. A falling denominator raises the ratio without the involved limb improving. The mechanism is a shrinking denominator, not an inflating numerator.
What is estimated preinjury capacity (EPIC) and how is it different from LSI?
EPIC uses the uninvolved limb measured before surgery as the denominator, holding the reference standard fixed. It prevents denominator drift from inflating the ratio but requires a pre-operative bilateral baseline most clinics have not historically collected.
Should I use hop tests or strength testing to calculate LSI?
They are not interchangeable. Hop-test LSI captures a composite of strength, power, coordination, and confidence and is sensitive to compensatory strategies. Strength-based LSI from isokinetic or isometric dynamometry isolates the contractile contribution more cleanly. An athlete can pass one and fail the other. Protocol reporting must specify the task.